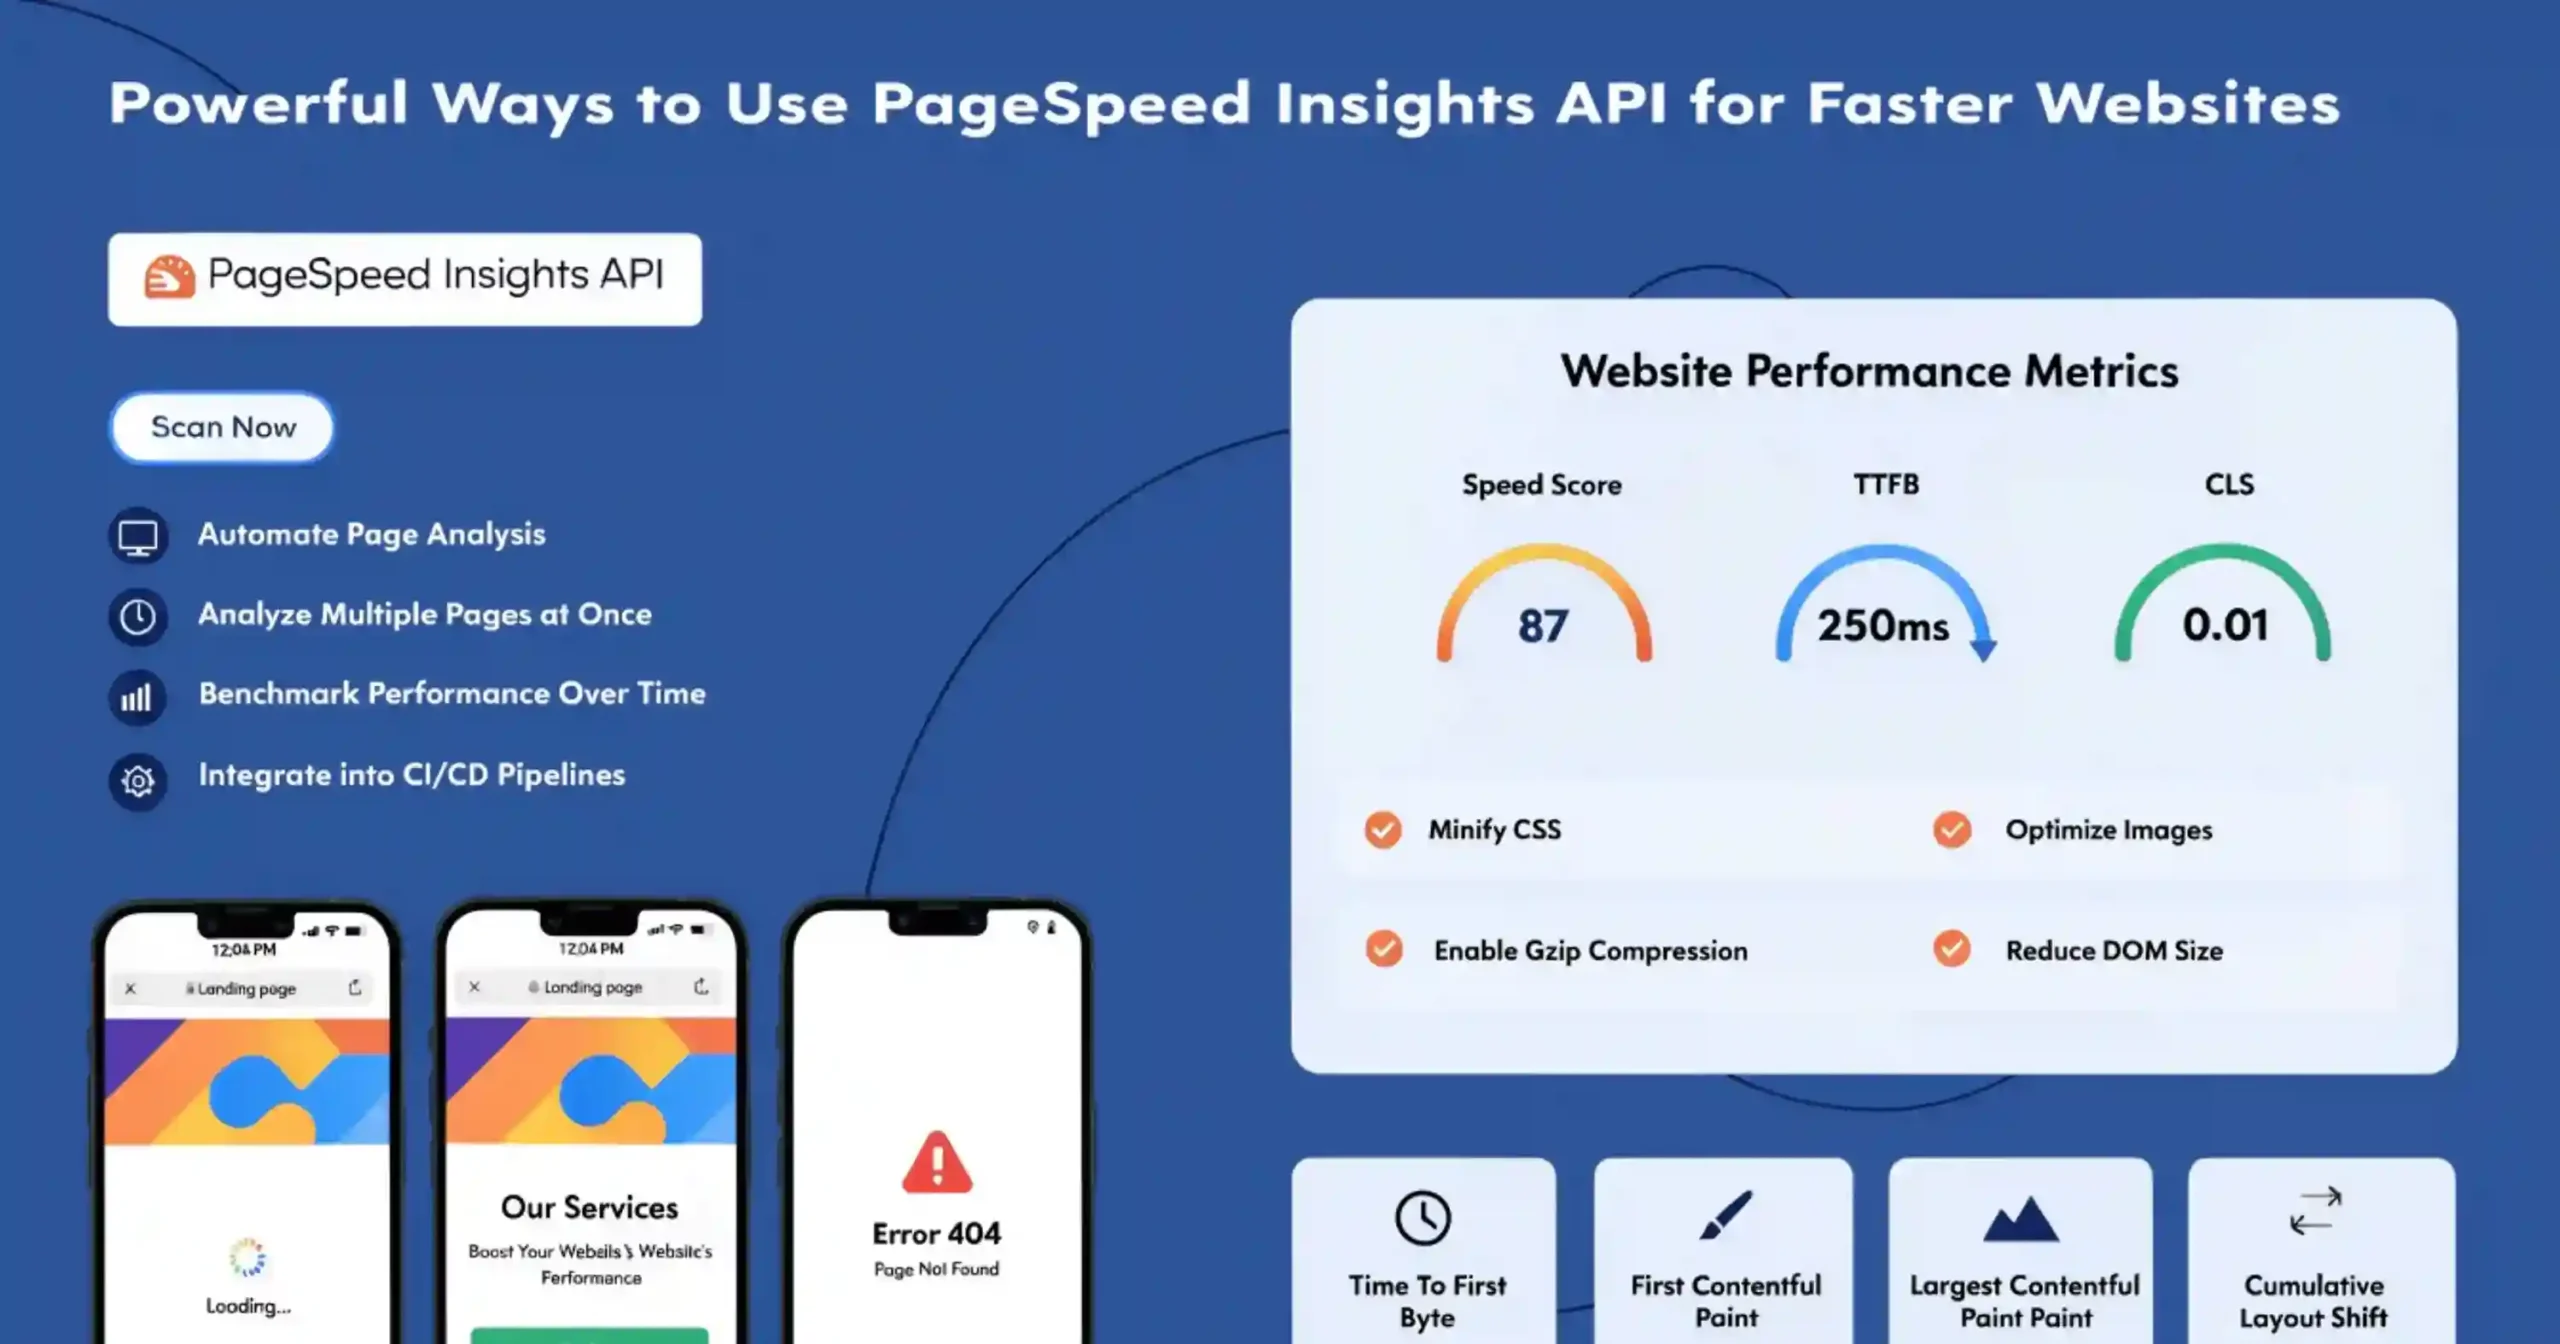
What is PageSpeed Insights (PSI)?
Slow websites aren’t just a tech headache—they chase people away. Nobody has patience for a site that drags its feet.
Google’s PageSpeed Insights makes things easy. It checks how quickly your site loads, on phones and laptops alike, and spits out straightforward scores with tips you can actually use to fix things up. Suddenly, speeding up your site isn’t just possible—it’s pretty doable.
PSI does something neat: it blends lab data (so you see how your site performs in a perfect world) with field data (how real visitors experience it). That combo gives you the big picture—what’s bogging your site down and how people actually feel about it.
Whether you’re tweaking an app or running a business and just want folks to stick around, PageSpeed Insights is a solid place to start. If you want your site fast and inviting, this is the tool you need.
Why Page Speed Matters for Your Website
Page speed isn’t just a tech problem—it’s a big deal for any business online now. If your site takes even one extra second to load, you can lose about 7% of your conversions. People want everything fast these days. If your site isn’t up in two seconds or less, most folks won’t wait around; they’ll just bail.
Google takes page speed seriously too. It uses it as a factor to rank websites, whether you’re on a phone or a desktop. So, the quicker your site, the higher you’re likely to show up in search results. Faster sites pull in more visitors, keep bounce rates down, and make people stay longer.
And speed isn’t just about SEO. It’s about making your site more accessible. Not everyone has speedy internet or fancy devices. If your site loads fast, you’re giving everyone a fair shot—like people using older phones or slow connections. That really matters if your customers are in places where digital access is still catching up.
If you want to see how your site’s doing, check out PageSpeed Insights. It breaks down exactly what’s slowing you down. With that info, you and your team can spot what needs fixing, and get your site running lean and mean.
Also Read: How to Use Branded Query Filtration to See Your Real SEO Performance
Lab Data vs Field Data — Understanding the Difference
One of the most distinctive features of PageSpeed Insights is its ability to combine two different types of performance measurement. Understanding how these differ is crucial for interpreting PSI results correctly.
What is Lab Data?
Lab data is collected in a controlled and simulated testing environment. PageSpeed Insights uses Google’s Lighthouse tool to simulate how a page loads under predefined conditions. For example:
- Mobile tests simulate a mid-range mobile device (Moto G4) on a slow mobile network
- Desktop tests simulate a high-performance desktop computer on a stable wired connection
- Because these conditions remain consistent, lab tests are highly repeatable and extremely useful for:
- Debugging performance problems
- Testing optimization changes
- Identifying resource bottlenecks
However, lab testing cannot perfectly represent the diversity of real-world conditions, such as different device types, browser versions, or network speeds.
What is Field Data?
Field data represents real-world user experience. Instead of simulations, it collects performance metrics from actual users visiting your website using Chrome browsers. This is also known as Real User Monitoring (RUM).
Field data reflects performance across:
- Different devices
- Various browser environments
- Multiple network speeds
- Diverse geographic regions
Because of this, field data provides the most accurate representation of how real users experience your website.
The limitation is that it requires a sufficient amount of real user traffic before data becomes available in PSI.
When Should You Use Each Type?
Both data types serve different purposes:
- Diagnosing technical performance problems
- Testing optimization improvements
- Running repeatable performance experiments
Use Field Data when:
- Understanding real user experience
- Validating performance improvements in production
- Measuring long-term performance trends
In practice, developers use lab data for debugging and field data for validation.
Real-User Experience Data: How PSI (PageSpeed Insight) Collects It
Chrome User Experience Report (CrUX)
PageSpeed Insights gets its real-world numbers from the Chrome User Experience Report, or CrUX for short. Basically, Google runs the show here, gathering anonymous performance data from folks using Chrome who’ve opted in to share how their browser’s doing.
CrUX is no small-time operation—it’s huge. We’re talking millions of sites, stretching across different countries, devices, and internet speeds. Because it’s so wide-ranging, CrUX is among the biggest sources of web performance data out there.
How Field Data Shows Up
The field data you see in PageSpeed Insights covers the past 28 days and shifts forward every day. So, it’s never just one random test, but a rolling month of real users’ experiences. That means you’re not thrown off by a tough day or a weird traffic spike; you get a steady read on how your site is really holding up. And since PageSpeed Insights updates daily, you can actually watch your site improve as you make changes.
What Happens When There’s Not Enough Data
Sometimes, PageSpeed Insights can’t show you field data for a page. Maybe your page is brand new, barely anyone visits, it’s behind a login, or bots are blocked. When that happens, PSI tries to pull data for your whole site instead. If there’s no site-level data either, you just get “lab data”—basically, test results from simulated conditions.
Key Metrics PageSpeed Insights Tracks
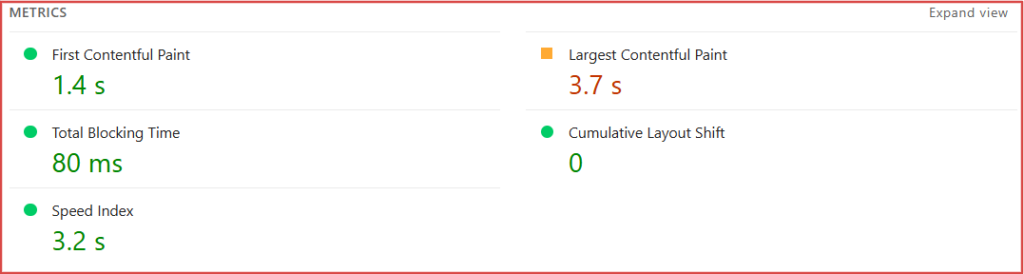
Here’s a quick rundown on what PSI checks:
- First Contentful Paint (FCP): This measures how much time passes between someone requesting your page and seeing the first bit of actual content (like text or images). Faster FCP means people feel like your site’s actually loading and they’re less likely to bail.
- Largest Contentful Paint (LCP): LCP clocks the load time for the biggest, main content element—think a huge banner or a big chunk of text. Google considers LCP the go-to metric for core content speed. Shoot for 2.5 seconds or less.
- Cumulative Layout Shift (CLS): Nobody wants a page where stuff jumps around while it loads. CLS measures how steady your layout is. If things move and users end up tapping the wrong thing, your CLS goes up (never good). Aim for a score of 0.1 or lower.
- Interaction to Next Paint (INP): INP tells you how responsive your site feels as users interact—clicking, tapping, typing, you name it. Unlike older metrics, INP tracks responsiveness throughout the page’s lifetime, not just the first click. Starting in 2024, INP replaced First Input Delay as a Core Web Vital. Keep this under 200 milliseconds.
- Time to First Byte (TTFB) – Experimental: This tracks how fast your server starts responding when the browser asks for your page. TTFB covers things like processing time, network delays, backend performance—basically, server-side speed. Still experimental in PageSpeed Insights, but super useful for spotting slowdowns. Try to keep TTFB under 800 milliseconds.
So, CrUX and PSI aren’t just running lab tests—they show you how real people experience your site every day. That’s what really matters.
Understanding PageSpeed Insight (PSI) Score Categories
PageSpeed Insights classifies metrics into three performance categories:
| Metric | Good | Needs Improvement | Poor |
| FCP | 0–1800 ms | 1800–3000 ms | >3000 ms |
| LCP | 0–2500 ms | 2500–4000 ms | >4000 ms |
| CLS | 0–0.1 | 0.1–0.25 | >0.25 |
| INP | 0–200 ms | 200–500 ms | >500 ms |
| TTFB | 0–800 ms | 800–1800 ms | >1800 ms |
The 75th Percentile Rule
PageSpeed Insights doesn’t care about averages or medians. It goes straight for the 75th percentile, meaning your score reflects what things are like for your slowest 25% of users. And that’s important—because it puts the spotlight on people stuck with older devices or spotty WiFi, not just those with sleek new phones and blazing-fast internet.
It’s not just nitpicking, either. Google wants the web to work well for everyone, no matter their phone or connection.
Core Web Vitals — The Big Three Metrics
Core Web Vitals are Google’s way of saying, “Hey, here’s what makes a site actually feel fast and easy to use.” There are three main ones right now:
- Largest Contentful Paint (LCP): How quickly the main content shows up.
- Interaction to Next Paint (INP): How fast your site responds when someone interacts with it.
- Cumulative Layout Shift (CLS): How steady everything looks—no random jumps or shifting layouts.
These Core Web Vitals matter for ranking, too. When you get them right, your users have a better time, and your site’s easier to find.
Passing the Core Web Vitals Test
To pass, all three metrics need to hit “Good” at the 75th percentile. If even one metric falls short, it’s a fail. PageSpeed Insights doesn’t make you guess—just Pass or Fail.
Lab Diagnostics with Lighthouse
Lighthouse is Google’s open-source testing tool built into PageSpeed Insights. Run a test and it simulates how your page loads, then checks performance step by step.
Every category gets a score from 0 to 100:
- 90–100 means Good,
- 50–89 says Needs Improvement,
- and anything below 50 is Poor.
But be careful—a great lab score doesn’t guarantee your users are getting the same results. Lab tests run in perfect conditions. Real people aren’t as lucky.
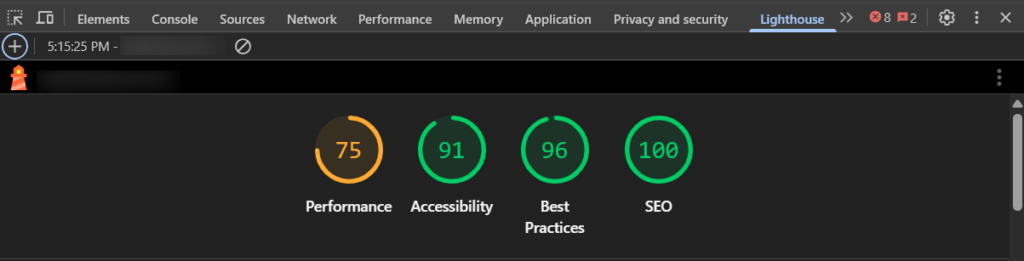
Lighthouse Audit Categories
Lighthouse checks four things:
- Performance: How quick and efficient everything is.
- Accessibility: Making sure people with disabilities aren’t left out.
- Best Practices: The basics—security, coding, and API usage.
- SEO: Basic search issues, like if Google can even read your page on mobile.
Device and Network Simulation
For mobile tests, Lighthouse pretends to be a Moto G4 phone using throttled 4G. For desktop, it runs on a speedy computer with a wired connection. Tests come out of Google data centers in North America, Europe, or Asia, and PSI shows you the test location.
Also Read: The Future of Marketing: Why Marketers Are Turning Into AI-Powered Strategists
How to Read PSI (PageSpeed Insight) Results
Distribution Bars
PSI uses color bars to show how your site’s doing:
- Green for Good,
- Amber for middle-of-the-road,
- Red for Poor.
Those bars aren’t decorations—the size of each section tells you how many real users had that type of experience. If most of the LCP bar’s green, most users saw fast load times.
Understanding the 75th Percentile Value
The big number above the bar? That’s the 75th percentile. It means 75% of visits hit that speed or better. If that number isn’t great, a chunk of your users are waiting around, even if others aren’t.
Common Questions About PageSpeed Insights
Why do lab and field data not match?
Lab tests run in the same environment every time. Field data is the wild west—different devices, networks, and places. Field data shows what users truly experience.
Why does my score change each test?
Performance scores jump around because things like network issues, server traffic, or your own computer get in the way. Run a few tests, take the average, and you’ll have a clearer picture.
Why is CrUX data missing?
You need public crawlability, steady traffic, and Chrome visitors in the last 28 days for PSI to show field data. If your site’s private, has low traffic, or isn’t visited much on Chrome, field data won’t show up.
Conclusion
PageSpeed Insights makes it simple to see how your site measures up. It combines real user data from Chrome with Lighthouse’s checks, so you get both the technical story and the actual user experience.
Here’s what really matters: website performance affects your users, your rankings, and your business. Know your Core Web Vitals. Aim for fast, stable pages that work for anyone and everyone.
Start with your site’s most important pages, spot what needs love, fix it, and keep going. When your scores go up, so does user happiness, search visibility, and your bottom line.